
Data Description
Cohort
Liver cancer segmentation: patients who were histologically diagnosed with hepatocellular carcinoma of the liver. Resection samples are used for the evaluation of AI learning models.
Scan image data of resected tissue slides will be provided. All cases are the tumor tissues of the liver which are diagnosed at SNUH, SNUBH, SMG-SNU BMC from 2005 to June 2018. All personal labels of scan images were removed in order to protect patients' privacy.
All cases are randomly arranged for training, validation, and test sets. All whole slide images were stained by hematoxylin and eosin and scanned by Aperio AT2 at x20 power.
Context Information
- Case number: randomly applied number after removing original specimen labeling
- Calculated value: area (mm^2) of the whole tumor area and the sum of viable tumor area
- Pathologic information: organ (liver), histology (hepatocellular carcinoma)
- Additional clinicopathologic data are not provided
Training Data: 50 WSIs
An individual slide is selected in one patient and contains one tumor lesion. Multiple or satellite lesions which normal non-tumor liver parenchyma is intervening two viable tumor cell nests in the same slide are excluded to prevent arguing for the whole tumor area. Viable tumor cell area is lined by the boundary between the cell nests and surrounding stroma, hemorrhage, cystic space or blank area.
We provide (1) original whole slide image, (2) XML annotation made by pathologists, (3) ground-truth binary pixel masks, which are generated from the XML annotation, for whole tumor area & viable tumor area, and (4) viable tumor burden calculated from the binary pixel masks.
Detailed information is as below;
- Original whole slide image (WSI): Original scanned image compressed in SVS format.
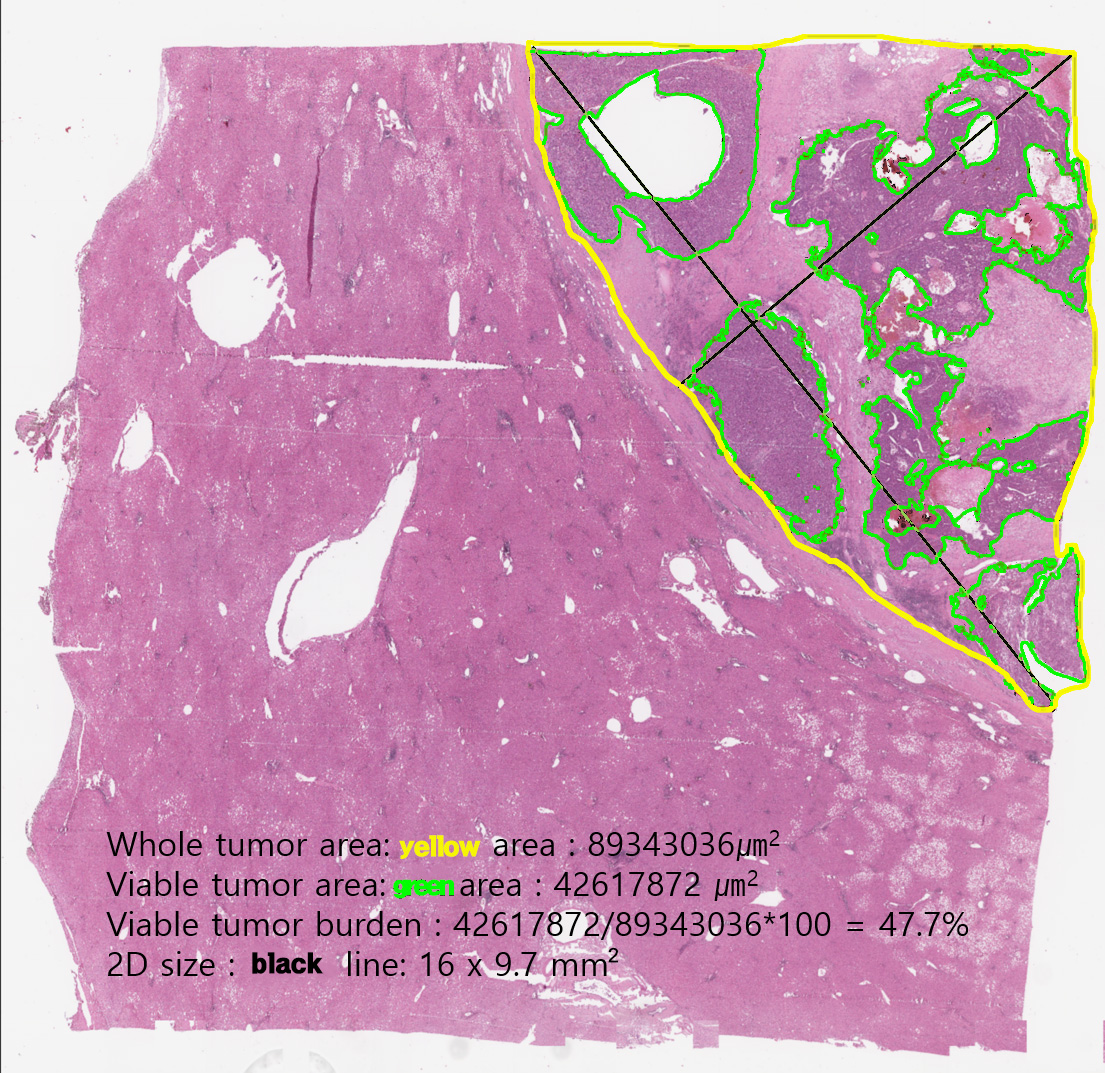
- Whole tumor area: single closed area lined by the Yellow line: This area is defined as the outermost boundary enclosing all dispersed viable tumor cell nests, tumor necrosis, and tumor capsule. One file holds one whole tumor area. The outermost area holding all viable tumor cell nests and tumor capsule which is the boundary of a tumor and non-tumor liver tissue.
- Viable tumor area: multiple closed regions or irregular ring-shaped region lined by the Green line: This region is defined as viable tumor cell nests and as precisely as possible, boundaries along the boundary between the cell and the surrounding stroma. Intratumoral hemorrhage, necrosis or non-tumor tissue region lined by same yellow line, so close area in the closed area means exclusive area. The aggregated area of at least 10 viable tumor cells which contact with each other.
- Viable tumor burden: area(mm^2) of the whole tumor area, the sum of viable tumor area, and the ratio of the sum of viable tumor area to the whole tumor area (i.e., Viable tumor burden). The given values are based on the Binary pixel masks, not on the XML annotations. (See below)
- Binary pixel masks for tumor area: binary pixel masks for whole tumor area & viable tumor area generated with a certain algorithm (see below) from XML annotations directly from experts
Details of Ground-Truth for the Train Data
[XML Annotation]
- We would like to clarify that the XML file is only for the reference and is not the ground truth. Binary pixel masks we've provided as TIF files are the ground truth.
- There are three regions in the XML annotation file of its
corresponding original whole slide image.
- The Annotation id="1", NegativeROA="0" denotes the Whole Tumor Area
- The Annotation id="2", NegativeROA="0" denotes the Viable Tumor Area
- The Annotation id="2", NegativeROA="1" denotes the Negative Pen Region
- Negative Pen Region means designated areas are not to be analyzed by the pathologists. Therefore, NegativeROA="1" should be ignored in the calculation of the tumor burden. We've excluded the negative pen region on the Binary pixel masks.
[Binary pixel masks from XML annotations]
Binary pixel masks were generated from the XML annotations based on the following rules:
- Generating Tissue masks with a threshold value-RGB(235, 210, 235)- for each original whole slide image; the pixel with a value above the threshold is considered as 'background'(non-tissue area), vice versa.
- The multiplied masks are the final Binary pixel masks
- Multiplying the preliminary Binary pixel masks and the Tissue masks to make the preliminary Binary pixel masks have more precise boundary
- Filling inside the closed polygons in XML annotations to generate preliminary Binary pixel masks for both Whole tumor area and Viable tumor area
- Filling in empty holes and removing small fractions of tissue smaller than 10 pixels in size (regarding them as noises) on the Tissue masks
Validation Data: 10 WSIs
- 10 patients cases with HCC resection. Each case per one slide and each slide must have tumor area having viable or non-viable tumor cells.
- Slides are provided randomly mixed. Slides are not annotated, e.g., whole tumor area and viable tumor cell nests
- The result generated using the Validation Data can be submitted for scoring. You can submit the result as many times as you want, and the leaderboard will be updated based on the highest score you get.
Test Data: 40 WSIs
- 40 patients cases with resected liver or liver biopsy specimen. Each case per one slide and each slide must have tumor area having viable or non-viable tumor cells.
- Slides are provided randomly mixed. Slides are not annotated, e.g., whole tumor area and viable tumor cell nests
- The Test Data does not include the Validation Data, and is used for the final scoring. Once you submit the result of the Test Data, it will be evaluated but the leaderboard will not be updated.
- The list of the final top 10 contestants will be announced immediately after the final submission deadline, and its ranking will be announced at the workshop.